ScreenOn: Measuring phone usage with Automate and Python
as gregor samsa awoke one morning from uneasy dreams he found himself refreshing twitter
— Boxᐸtefᐳ (@tef_ebooks) 4 agosto 2018
Some time ago, I was a bit nervous, so I started to browse twitter on my phone. I didn't start using it because I received a notification or a friend sent me an interesting post, but to divert my attention to the task I should have been working on. After some minutes spent scrolling the timeline, it seemed to me that I "woke up" and understood what I was doing. I understood that it was not the first time it happened, but it was just the last occurrence of a long series of "procrastination attack".
I needed to stop wasting my time reading rants of randos on the internet. Before working on a solution, though, I wanted to know how much time I actually was spending on the phone.
So, I started working, and created ScreenOn. The solution is composed of three parts:
- an Automate flow to read screen status and save every change to a local sqlite3 database
- an Automate flow to push screen changes from sqlite3 to a Python web application
- a web application (Python+javascript) to store and see visualizations/stats
The code and the applet are available on Github.
Automate flows

Automate is an Android application that lets you develop your own programs via a visual language. To create a program, you add, configure and connect blocks, and each block corresponds to a single action or condition. In a single program, you can create different flows, that are executed in parallel.
As you can see, there are different flows:
- Start: detect screen status changes (when it turns on or off), and save them
- to an sqlite database
- Backup: save screen changes records to a Python webservice on the same network
- Config: configures the database
When the screen turns on or off, the applet saves the current time as a unix timestamp, and the status of the screen (1 = on, 0 = off).
Web application
ScreenOn has a web application, with a Polymer frontend The data are provided by the Python webservice that is also invoked by the Backup Automate flow.
The web application lets us interact with some charts, so let's see them!
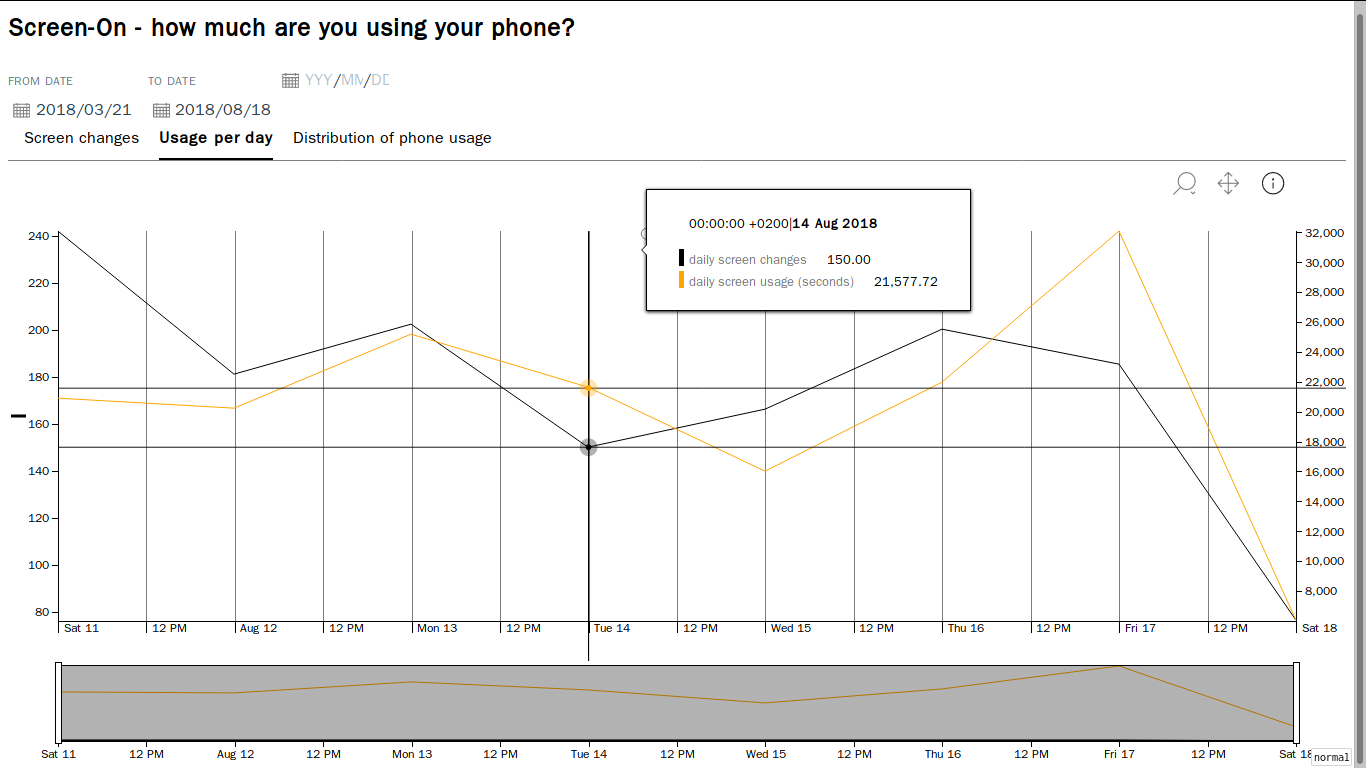
Usage per Day is the default view: for each day in the selected period, it shows the time spent on the phone and how many times the screen was turned on and off that day.
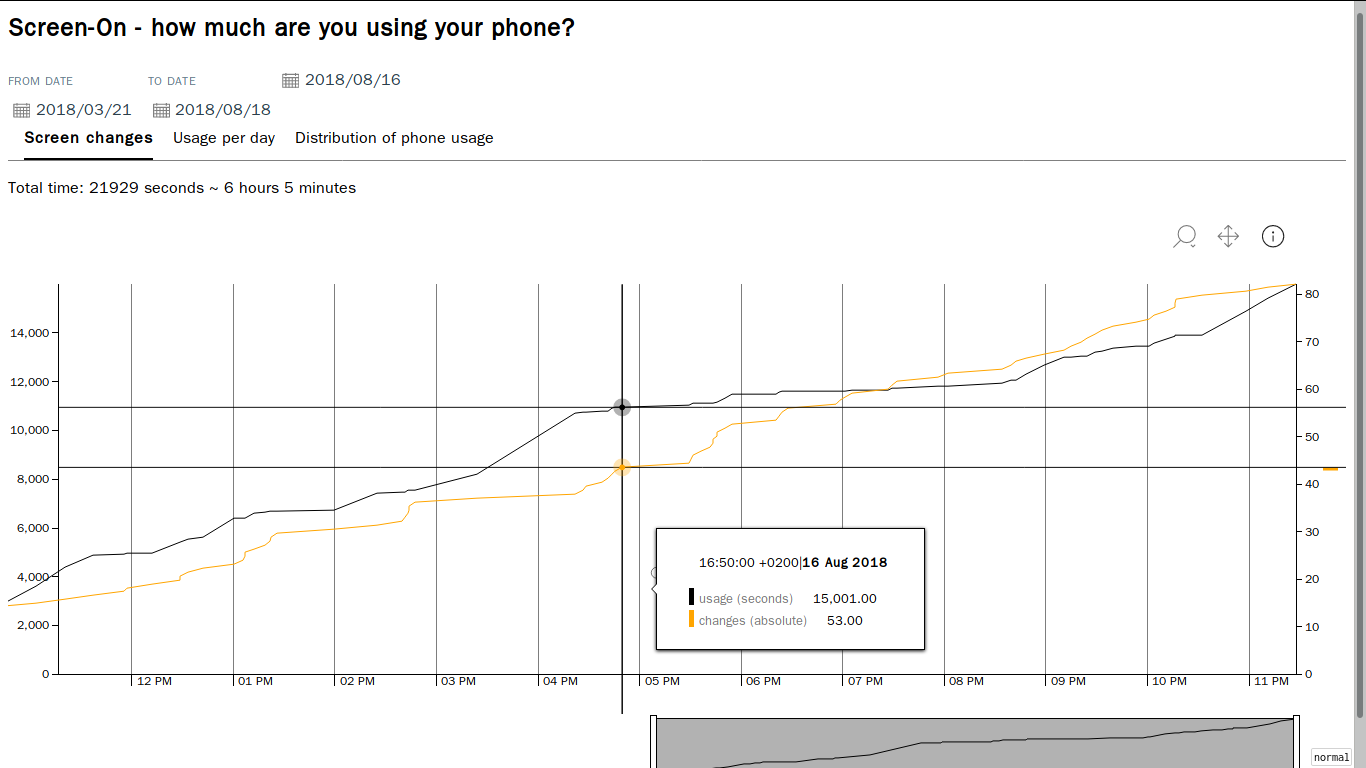
Screen Changes is a cumulative chart of the phone usage time in the selected day, and how many changes triggered the changes. The "screen status changes" line should help users understand short-timed phone usages.
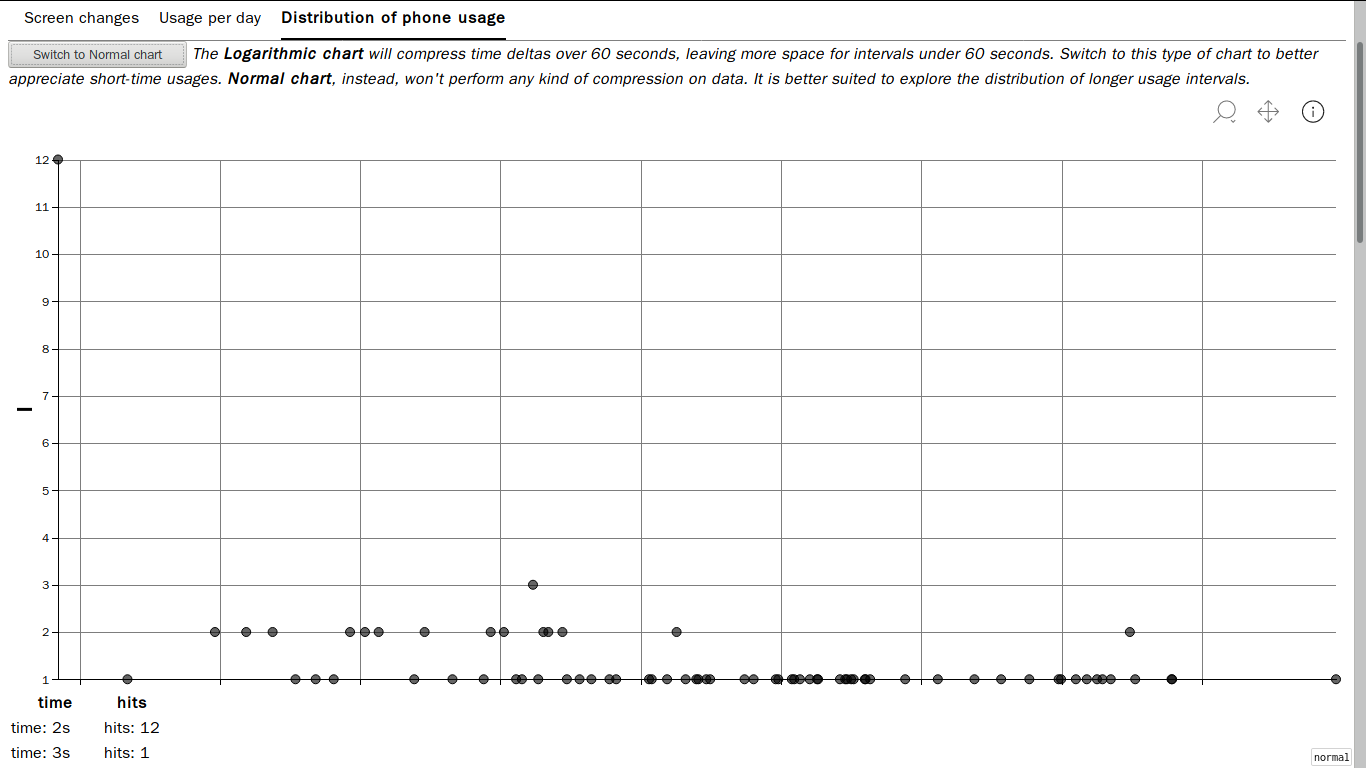
Distribution of Usage aims to highlight the duration of the usage, using a xy-scatter chart. On the x-axis, we can find the interval of time when the phone screen was turned on. On the y-axis, we can find how many times that interval "happened".
There are two "modes": the default one (Logarithmic) aims to highlight the short-timed usages, by applying the log operation to the time intervals. This operation compresses the larger values, while leaving more space to the smaller values.
The other one, Normal does not apply any compression to the data, and is better suited when we need to analyze longer time intervals.
Analysis
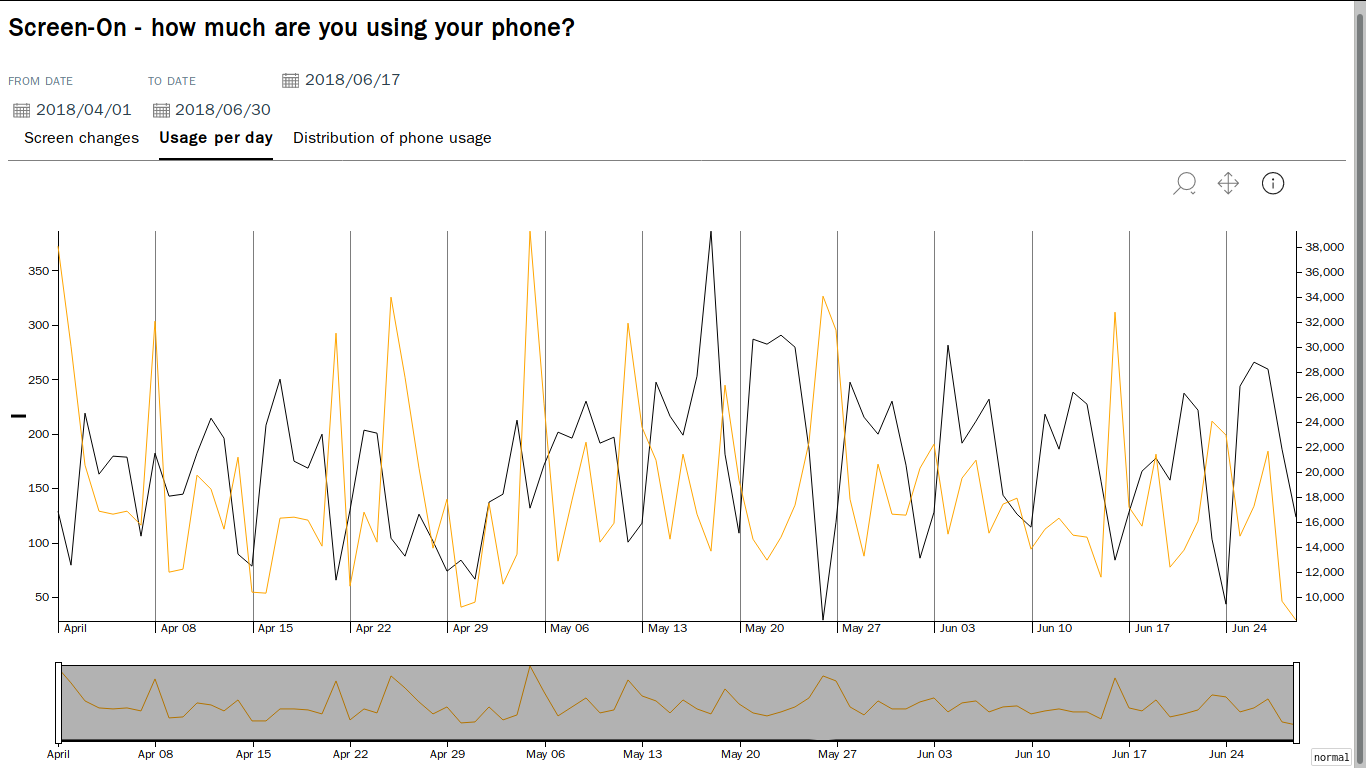
This is the daily usage chart, from April to June 2018. We can see that the behavior is more or less the same every week: on work days (from Monday to Friday) I use the phone less than during the week-end (Saturday and Sunday). The only exception is 25th of April, that is a national holiday in Italy.
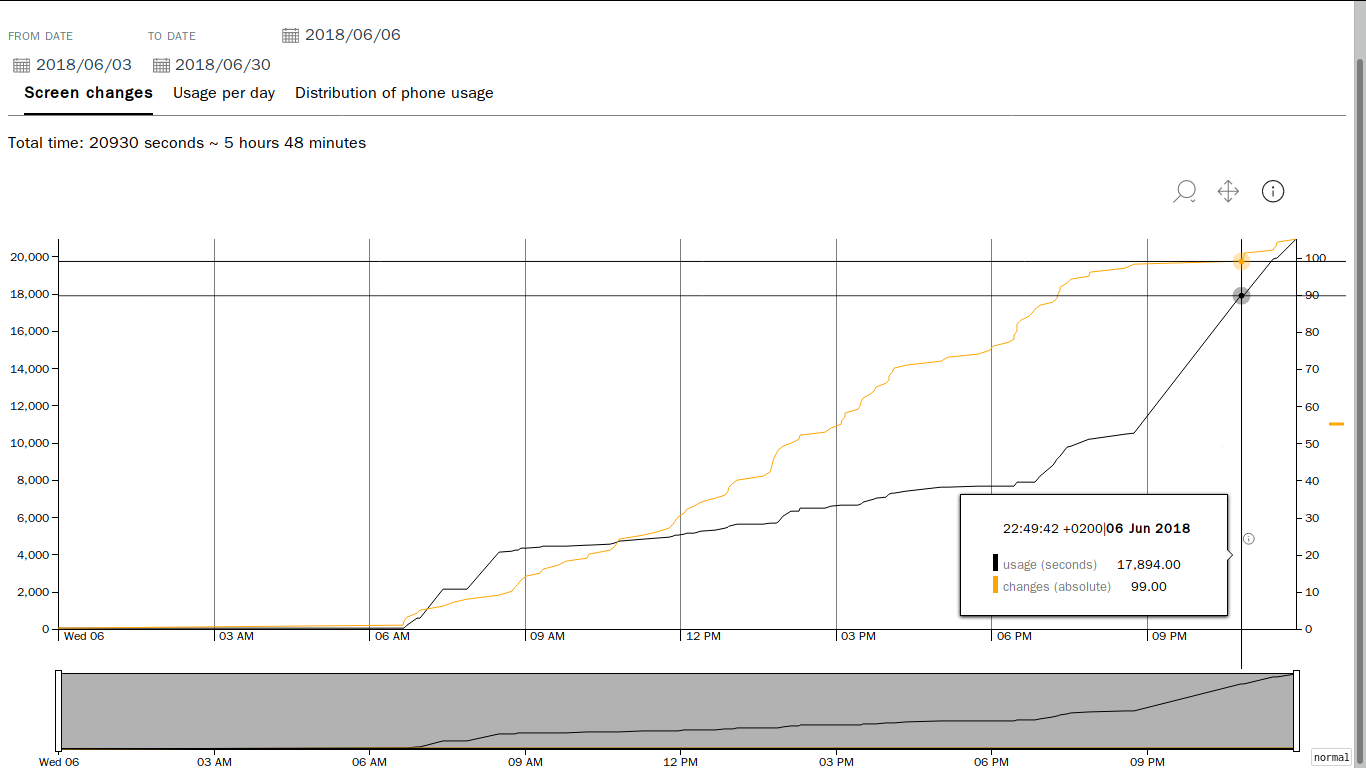
This is an example of a Wednesday, a normal work day. There are some things I can show you:
- My work hours are from 9 AM to 6 PM, so you can see that I don't use the phone very much during that time. The increase near 2 PM is my lunch break: I scroll Twitter, check my private email account, and show small videos to friends.
- At the time, I was using Youtube as my music player when on the road. It was before the Premium stuff, so you had to keep your screen on even if the phone was in the pocket and you weren't looking at it.
- Every Wednesday evening, a streamer I follow on Twitch.tv streams a lore walk-through of the whole Metal Gear Solid saga, and every stream is ~3 hours long...
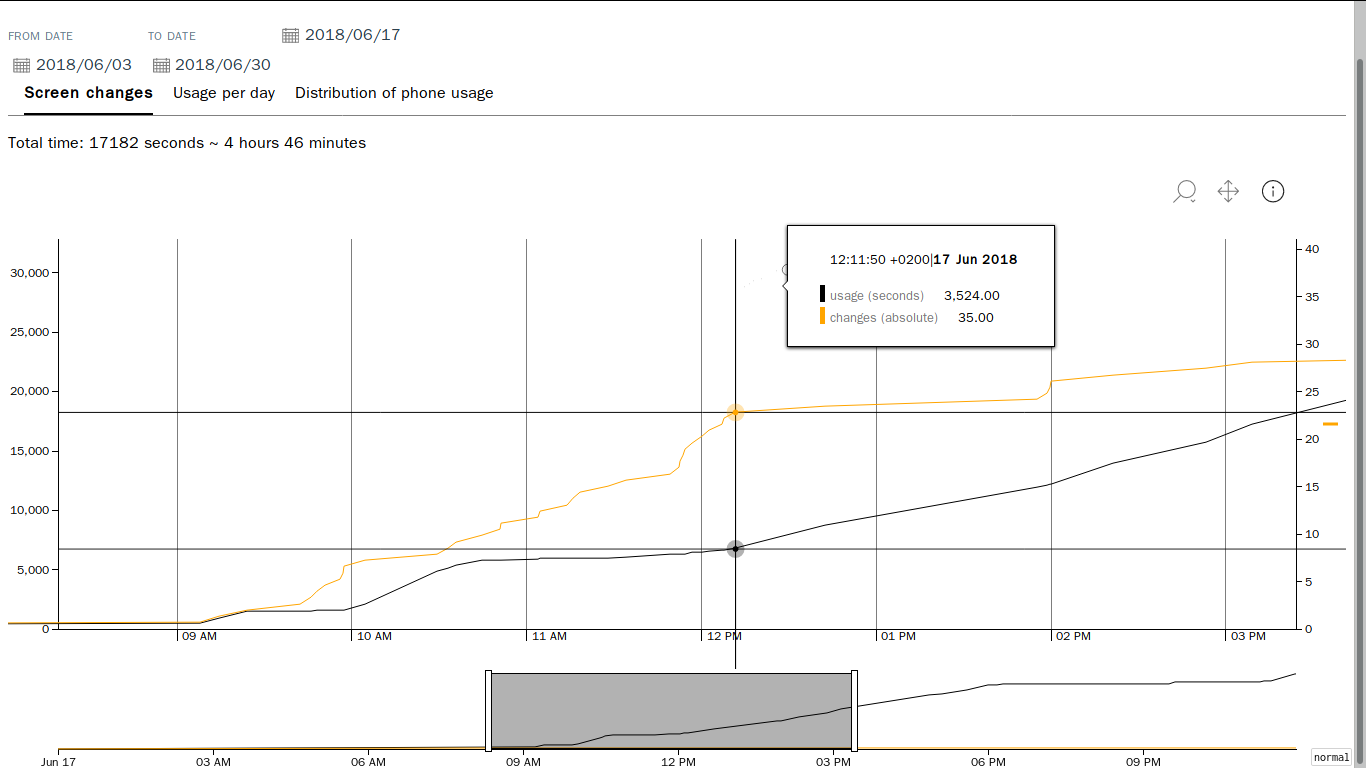
This screenshot will help us see how the Screen Changes chart looks like when there are a lot of small changes.
As we can see, between 11 AM and 1 PM I used the phone several times in a row for short period of times. We can understand that by seeing that the black line (the time the screen was turned on) grows slowly, but the orange line (the number of changes) grows very fast in the same interval.
Next Steps
No software is ever finished. ScreenOn can benefit from additional work. Some of the next steps are purely technical, others aim to capture more data in order to better understand why the user is using their phone and how they're spending their time.
1) CSV Exports
Sure, an user could just stop the web application, dump the database and restart the application, but why should they do that? What if you want to perform some other kind of analysis on the data? I want to empower the users and let them create their own analyses.
2) Handle timezones better
Right now, the Automate flow that records the screen changes only records an unix timestamp. It may works in a narrow set of conditions, such as the phone never changes the timezone and the browser is in the same timezone of the phone. ScreenOn can do better: the user should be able to set a preferred timezone, or set the chart to use data's timezone!
3) Twitch/Youtube is not Twitter/Mastodon scrolling!
In the analysis, we saw that the phone was used for long period of times during evenings and nights. Personally, I prefer to turn on Youtube or Twitch on my mobile device, either as TV-like device or to actively see my favourite content creators on those platforms. I don't know how to implement it yet, but it should not be very difficult.
4) Ask why you are using the phone, if using it for more that X minutes or X times in an hour
There is a reason if someone is using their phone so much. Maybe they're stuck waiting in traffic, or waiting for the build to finish. What if they just could be anxious or don't want to think about something that makes them nervous?
If this is the case, "setting a goal to use the phone less" is just treating the symptoms instead of curing the disease: the phone became an anxiety-relief device, nervous people will use something else instead. A tracker like ScreenOn cannot register context, so the Automate applet may periodically ask the user how they feel and why are they using the phone.
If you want to propose a new kind of chart, or point out some errors and typos, don't hesitate and let me know! Contact me on Twitter. If you liked this article, why don't you offer me a Ko-Fi ?